Testing air quality monitors is a tricky business. Not only is it difficult to know precisely how accurately your monitor is reading, but the equipment to test the accuracy of some parameters (like particle matter/PM) is costly.
To get an ‘accurate’ baseline to compare the PM values from your consumer-grade air quality monitor to, you would need to spend tens of thousands of dollars to purchase what is referred to as a ‘reference-grade’ monitor. Unfortunately, these devices are incredibly expensive, complex to operate, often very large, and generally inaccessible to the public. If this is the case, how can you even tell how accurate your air quality monitor is?
Luckily, a few organisations and companies out there have access to reference-grade equipment and carry out comparisons between this equipment and low-cost air quality monitors and sensors. In fact, if you’ve done any research at all into air quality monitors, you’re probably already aware of the first organisation that carries out these tests.
In this short post, I want to discuss how you can use these platforms to view the accuracy of consumer-grade air quality monitors. However, while I hope this post proves helpful for prospective customers, please also keep in mind that this post is a very surface-level look, as anything in-depth would quickly become a one-hundred-page document.
AQMD AQ-SPEC
If you’ve heard of any of the organisations on this list, The South Coast Air Quality Management District is probably the one. This organisation runs a program called AQ-SPEC, which compares popular consumer-grade monitors to reference-grade equipment in Southern California.
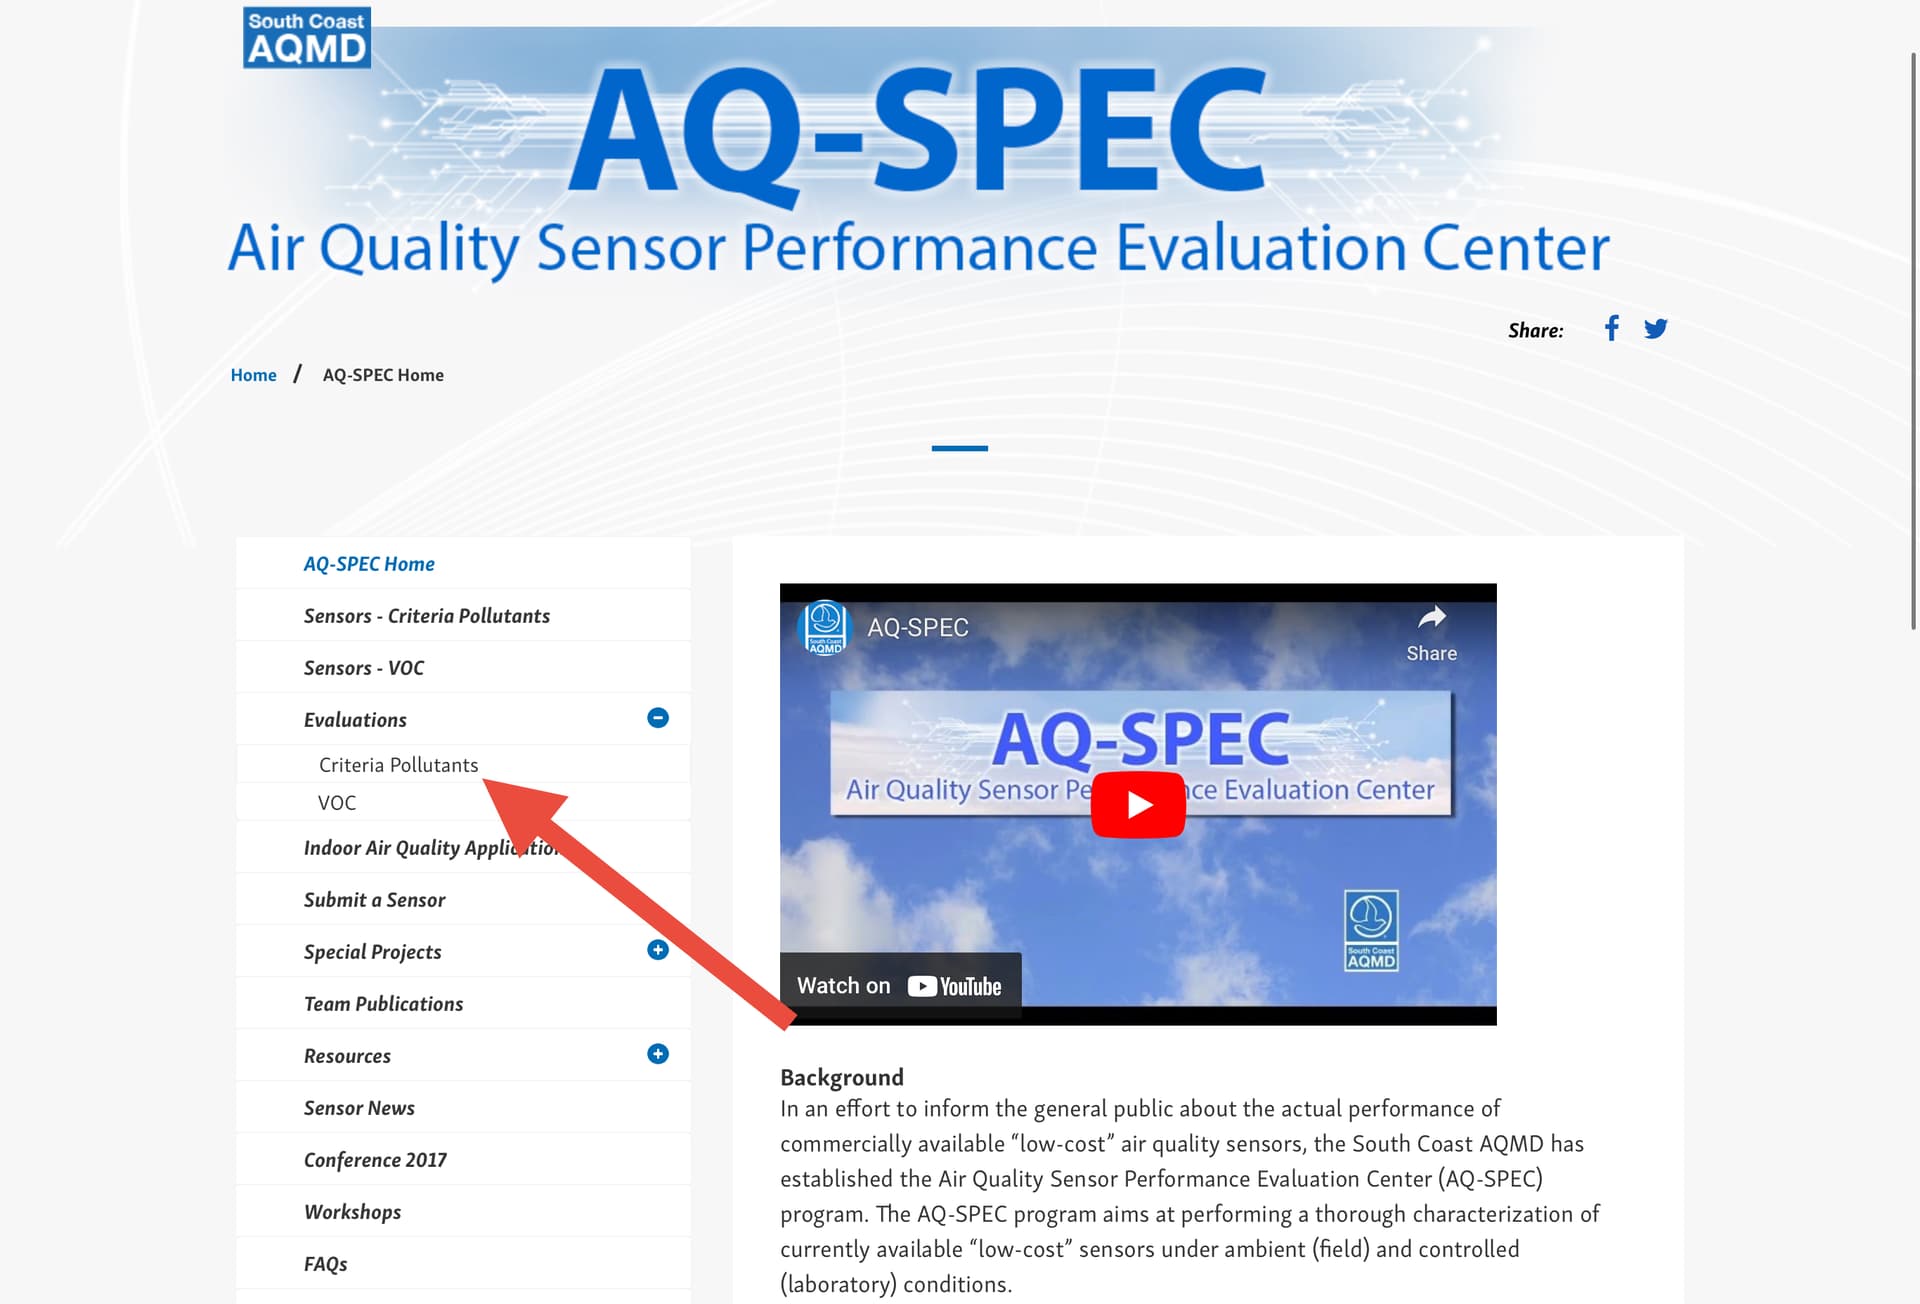
To find the evaluation database, first Google ‘AQ-SPEC’ and visit the website. if you can’t load the website, you’re likely in a country that has been blocked. For some reason, when I’m in Vietnam or the Philippines I am unable to access this website, but I can in New Zealand. If you run into this issue and the page doesn’t load, please use a VPN and try accessing from a U.S. IP address.
Once there, click on ‘Evaluations’ and then ‘Criteria Pollutants’.
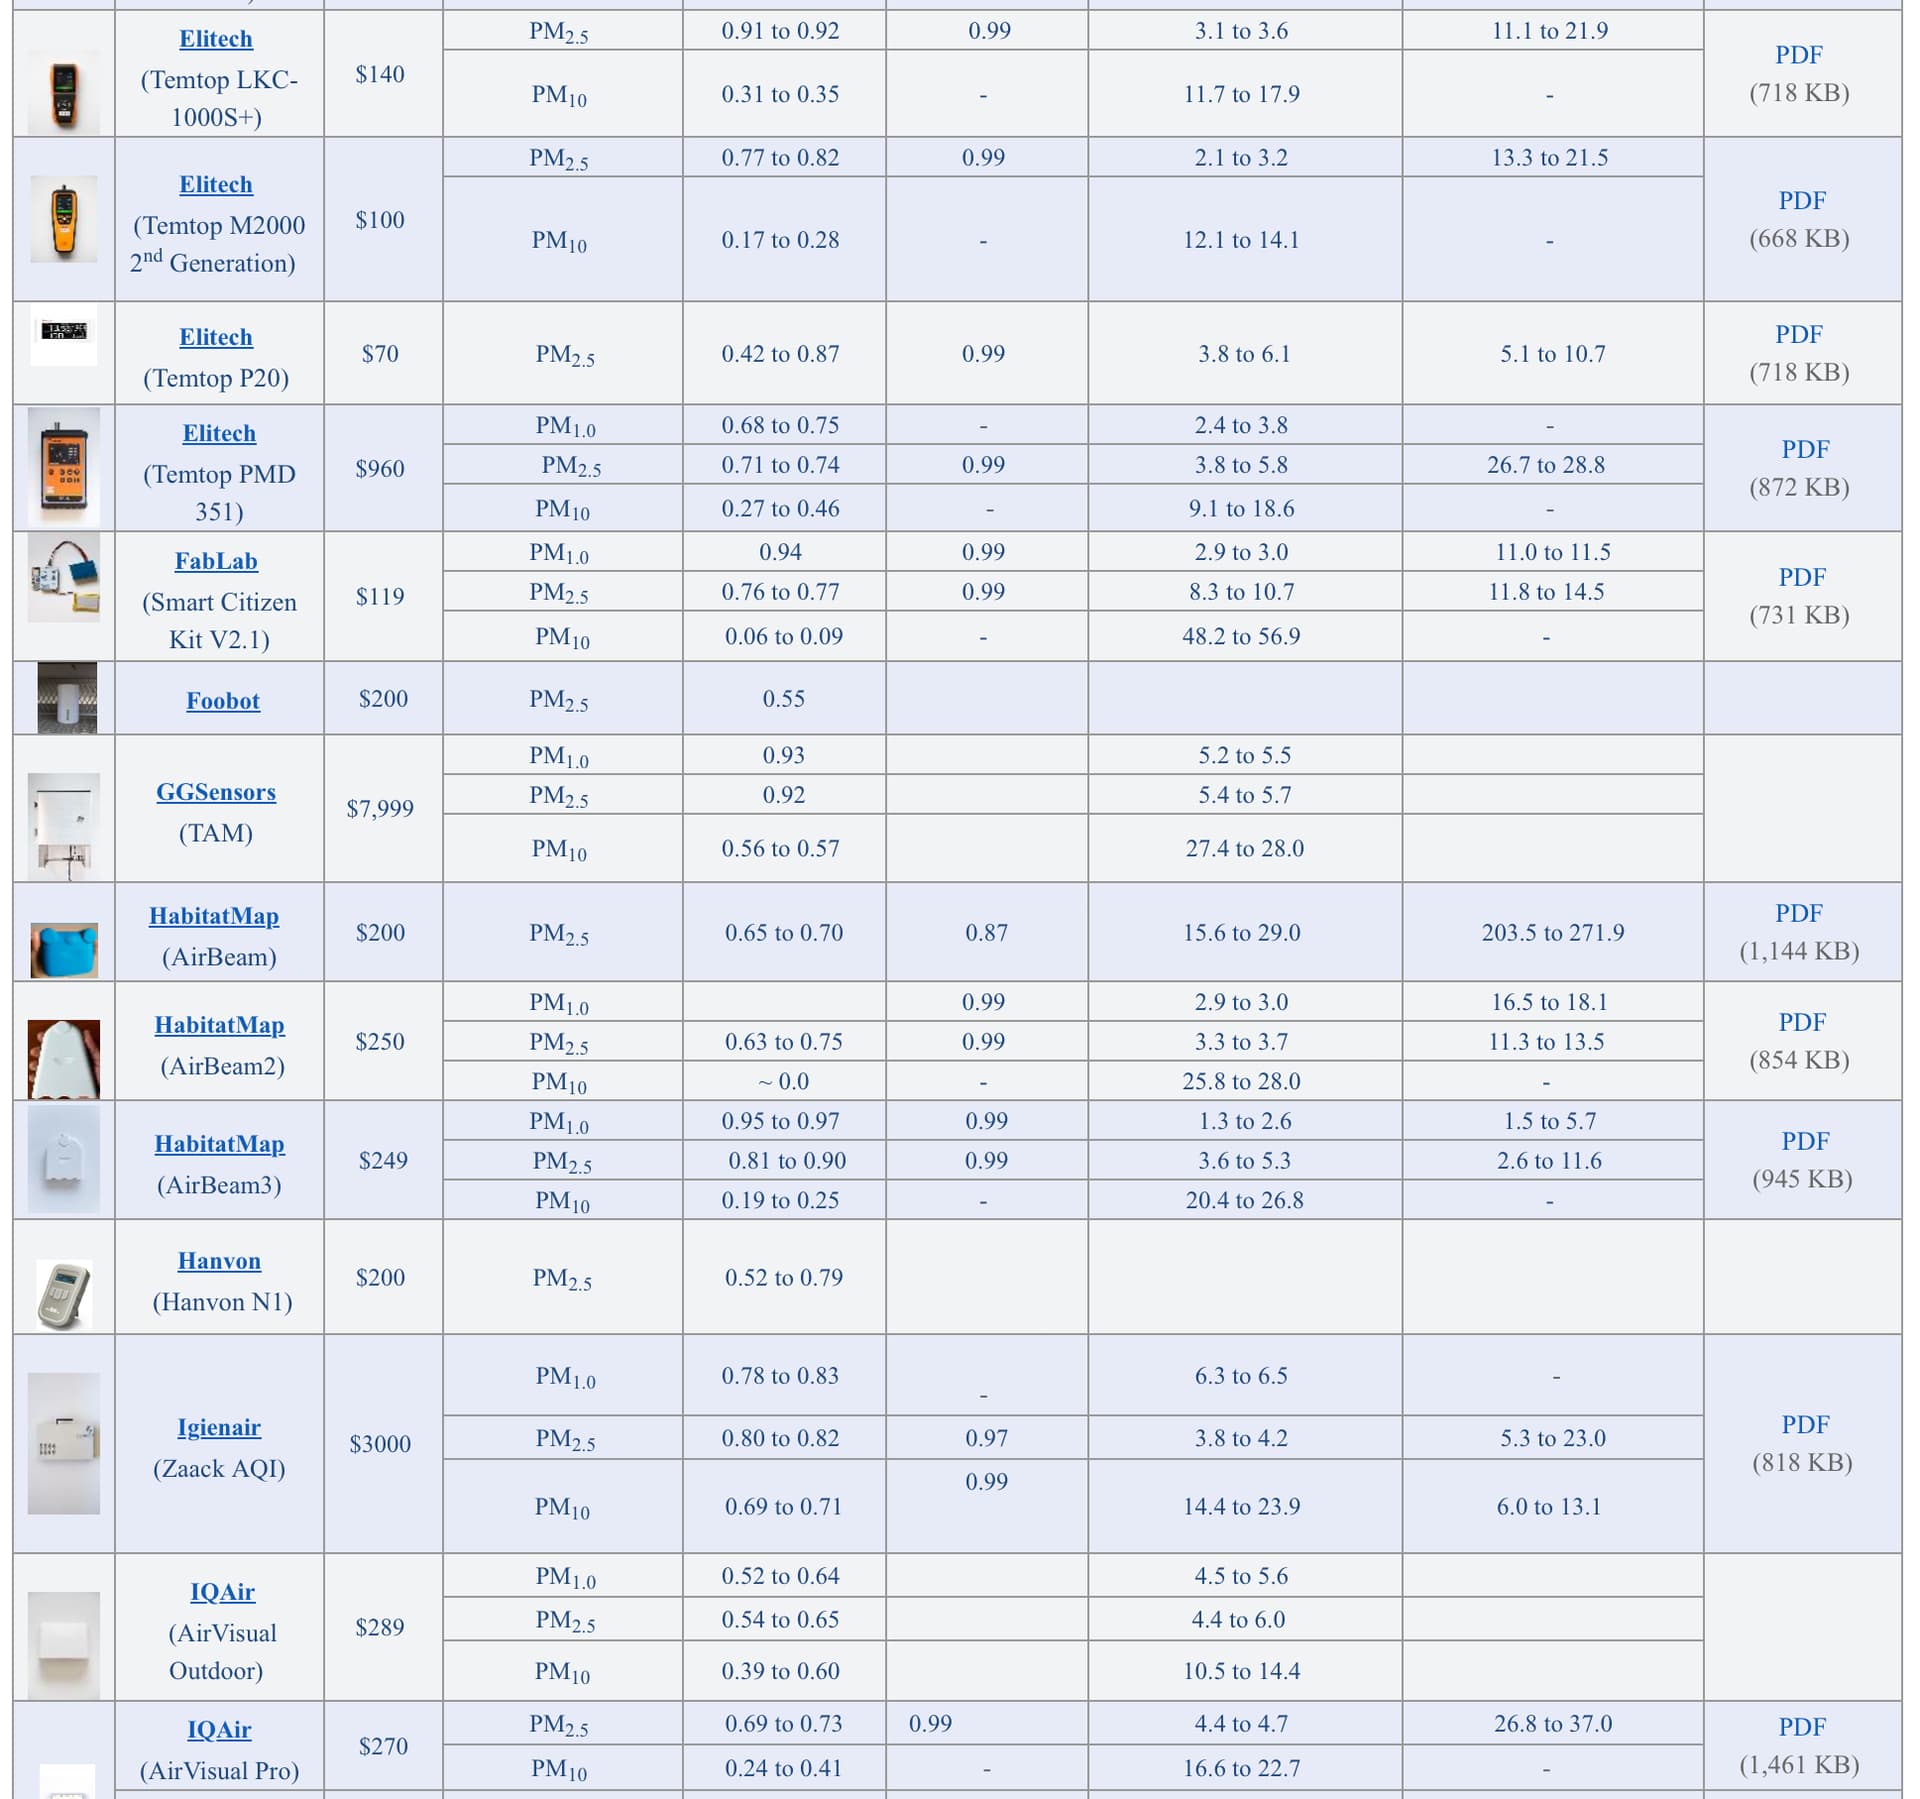
You will now be presented with a comparison table similar to the one in the image above. This is the database of every monitor that has been tested as part of the program, and you can get a brief overview of the pertinent information here. It’s worth noting that the ‘Lab Evaluation’ column is not worth considering, as nearly every monitor is capable of achieving an R-squared value of 0.99. Rather, the ‘Field Evaluation’ column is important, and you will want to keep an eye on the R-squared values for PM2.5.
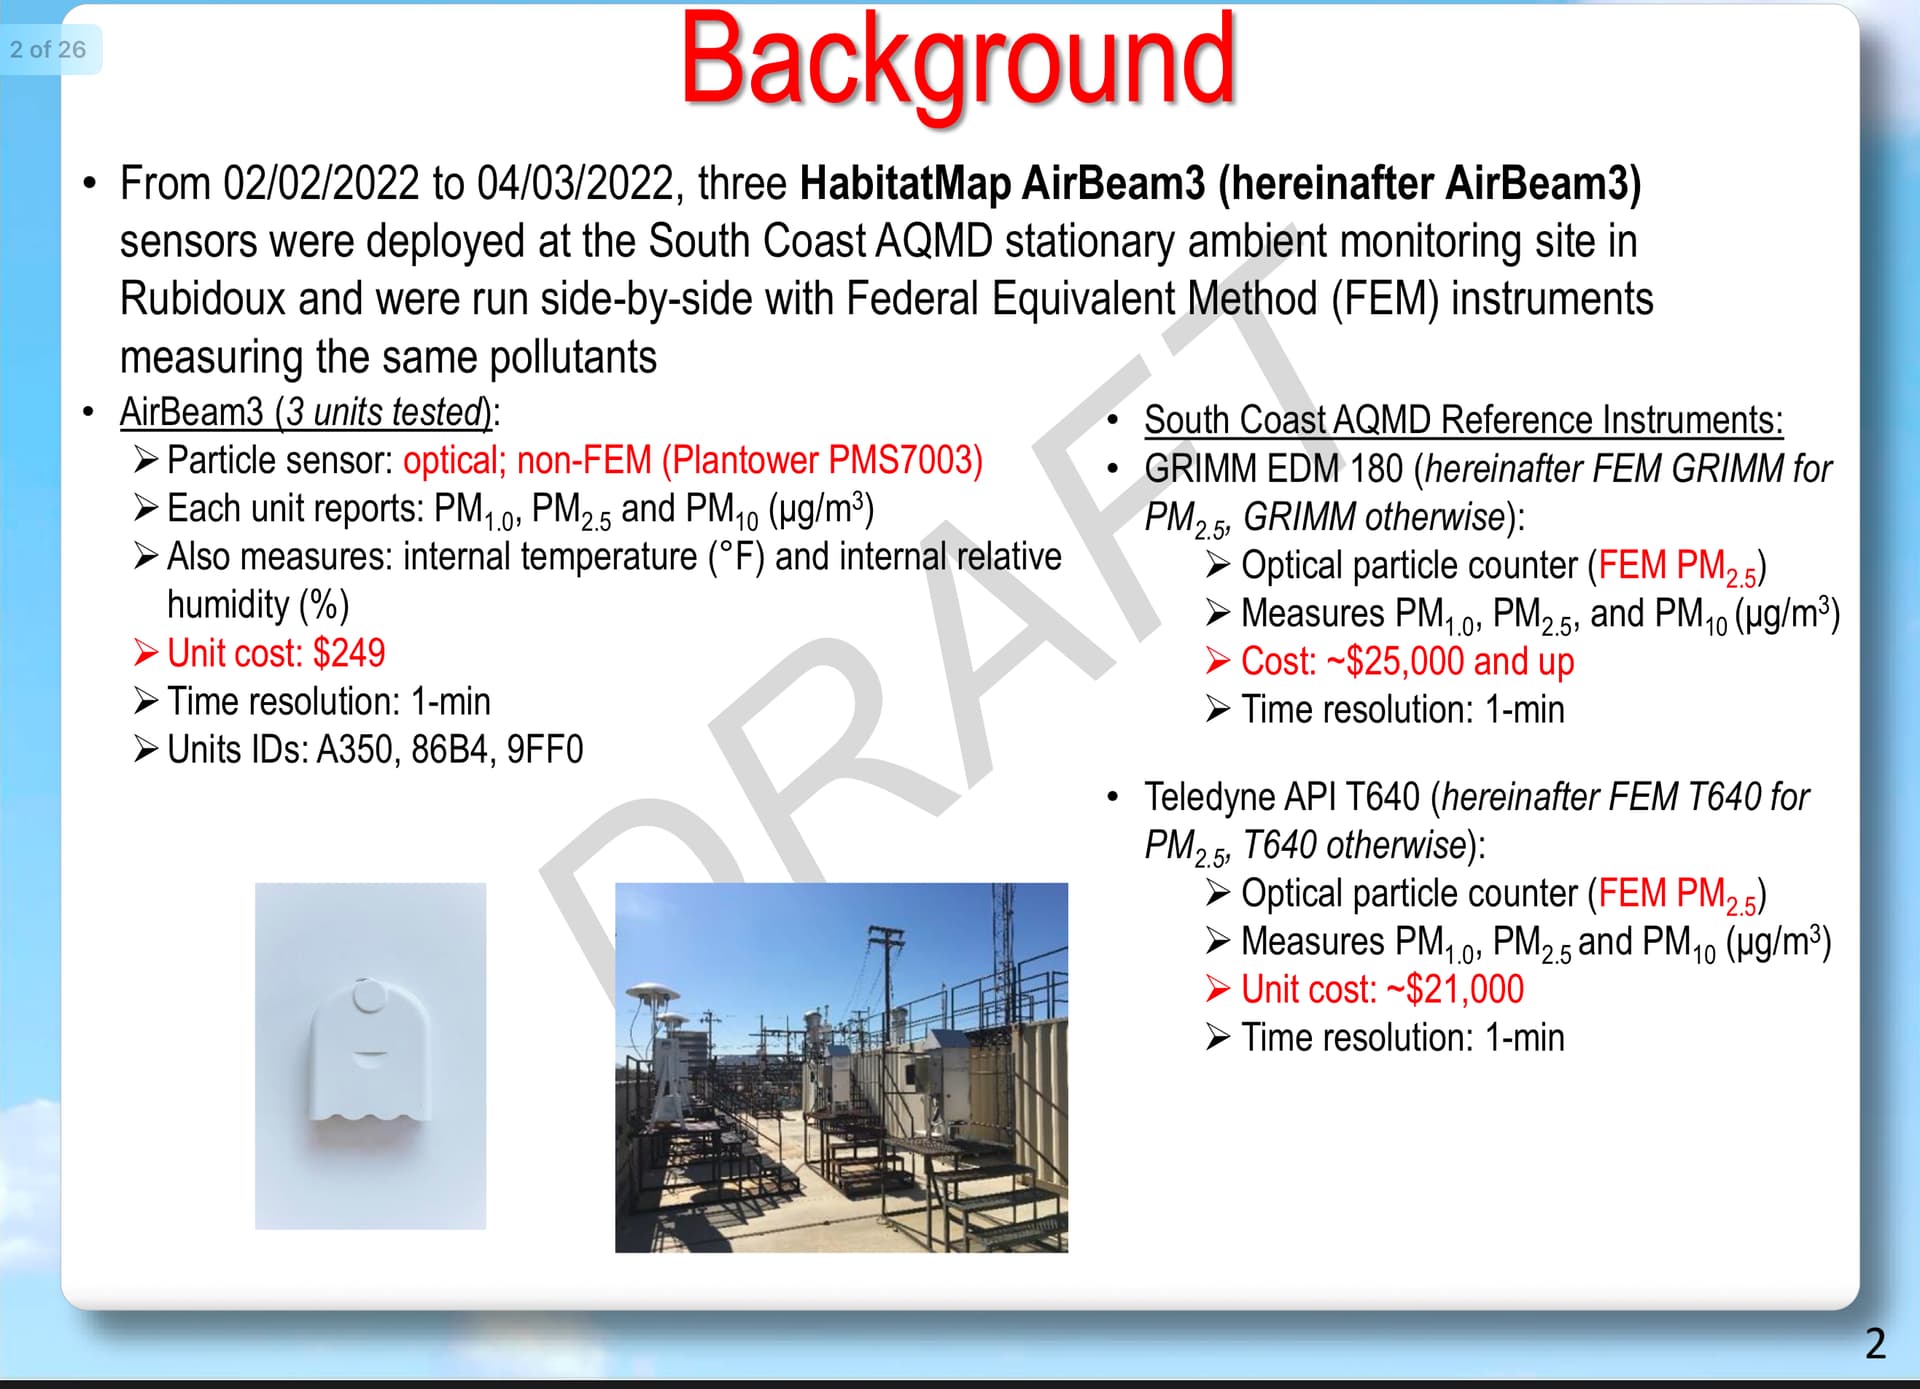
If you want to see further details on the device, you can click on the ‘PDF’ link in the column at the right-most. This will take you to a page with a full document investigating the performance of the device.
The AQ-SPEC program is a good program, and I think they do great work. However, it’s also very flawed and too many people use the results from AQ-SPEC as their sole reason to purchase (or not purchase a monitor). If you are comparing monitors on AQ-SPEC, it’s important to keep in mind that these results are NOT the be-all and end-all because the comparisons are not consistent.
For example, monitors in the AQ-SPEC program are tested in different conditions every time. Particle counters, especially low-cost sensors, are very susceptible to environmental conditions, and a sensor tested in two different seasons or even two different days may have vastly different performance based on weather conditions, among other factors. On top of this, sometimes different reference-grade stations are used for comparison, and these can even provide different results.
For this reason, I recommend considering the AQ-SPEC results, but only as part of your purchasing decision.
AIRLAB
A better tool for comparing the accuracy of monitors is the AIRLAB Microsensor Comparison Tool. Unfortunately, it also seems that far fewer people are aware of this database.
Why do I say it’s better? Well, every monitor that is tested is placed in two locations (Paris and Thailand - I believe in Bangkok) for two months alongside one another. This means that not only is there far more data included in these results, but the results are also directly comparable. Of course, this database is still far from perfect, and it only accounts for weather patterns found in Paris and Thailand, but it is much more thorough than AQ-SPEC.
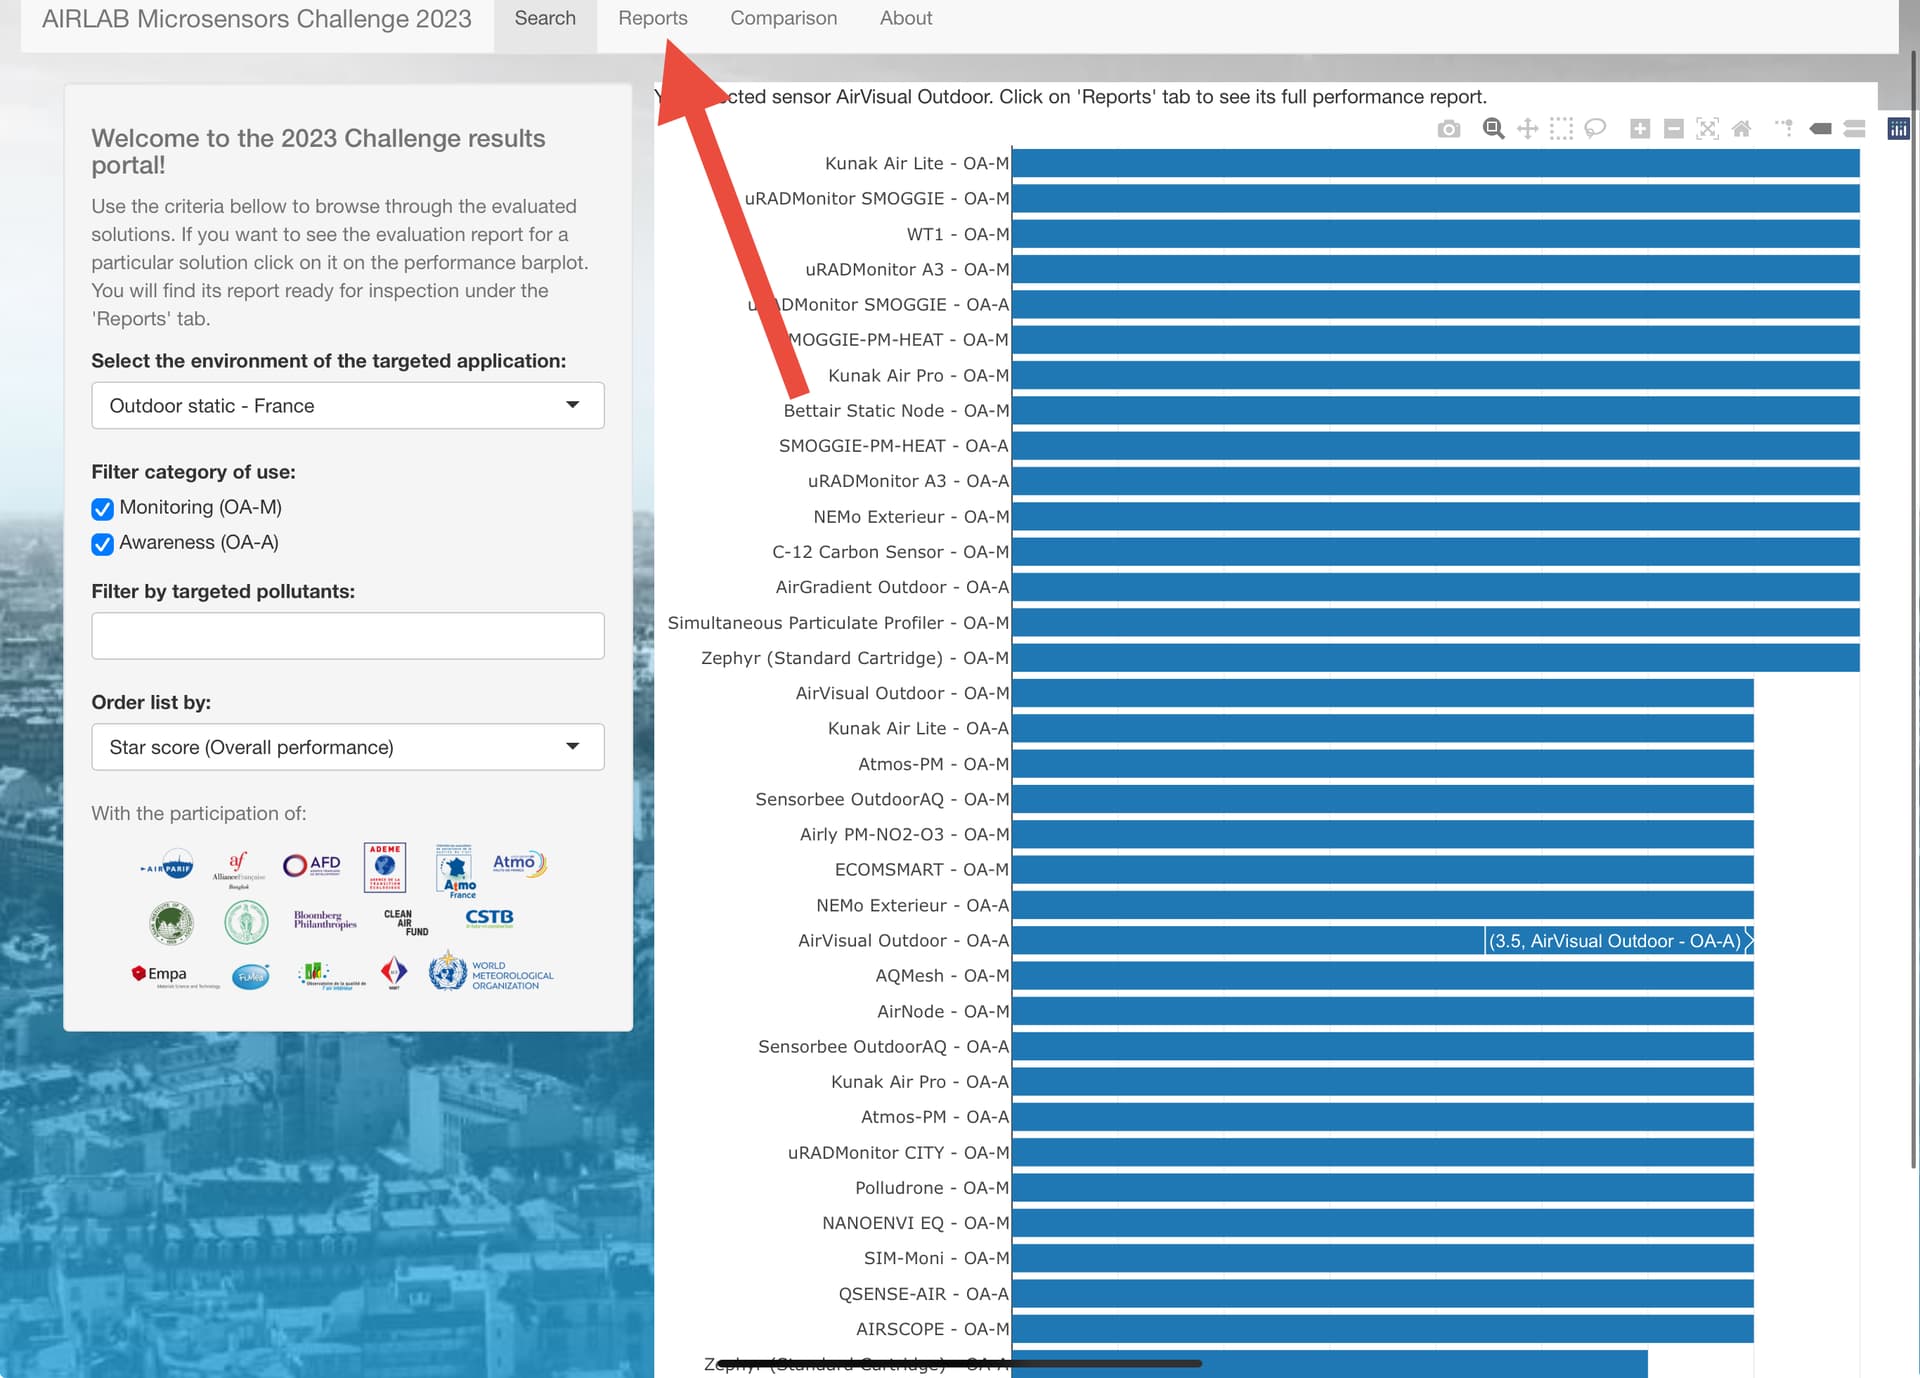
When you first visit the AIRLAB Microsensors Challenge page, you will be met with the view above. I’m not a big fan of this page, as it rates every device on a 0-5 scale. While they do explain their methodology for these scores, and they are easy to understand, I prefer seeing the data. As such, you will want to select a monitor from the graph (just click on it) and then click on the ‘Reports’ tab at the top of the page.
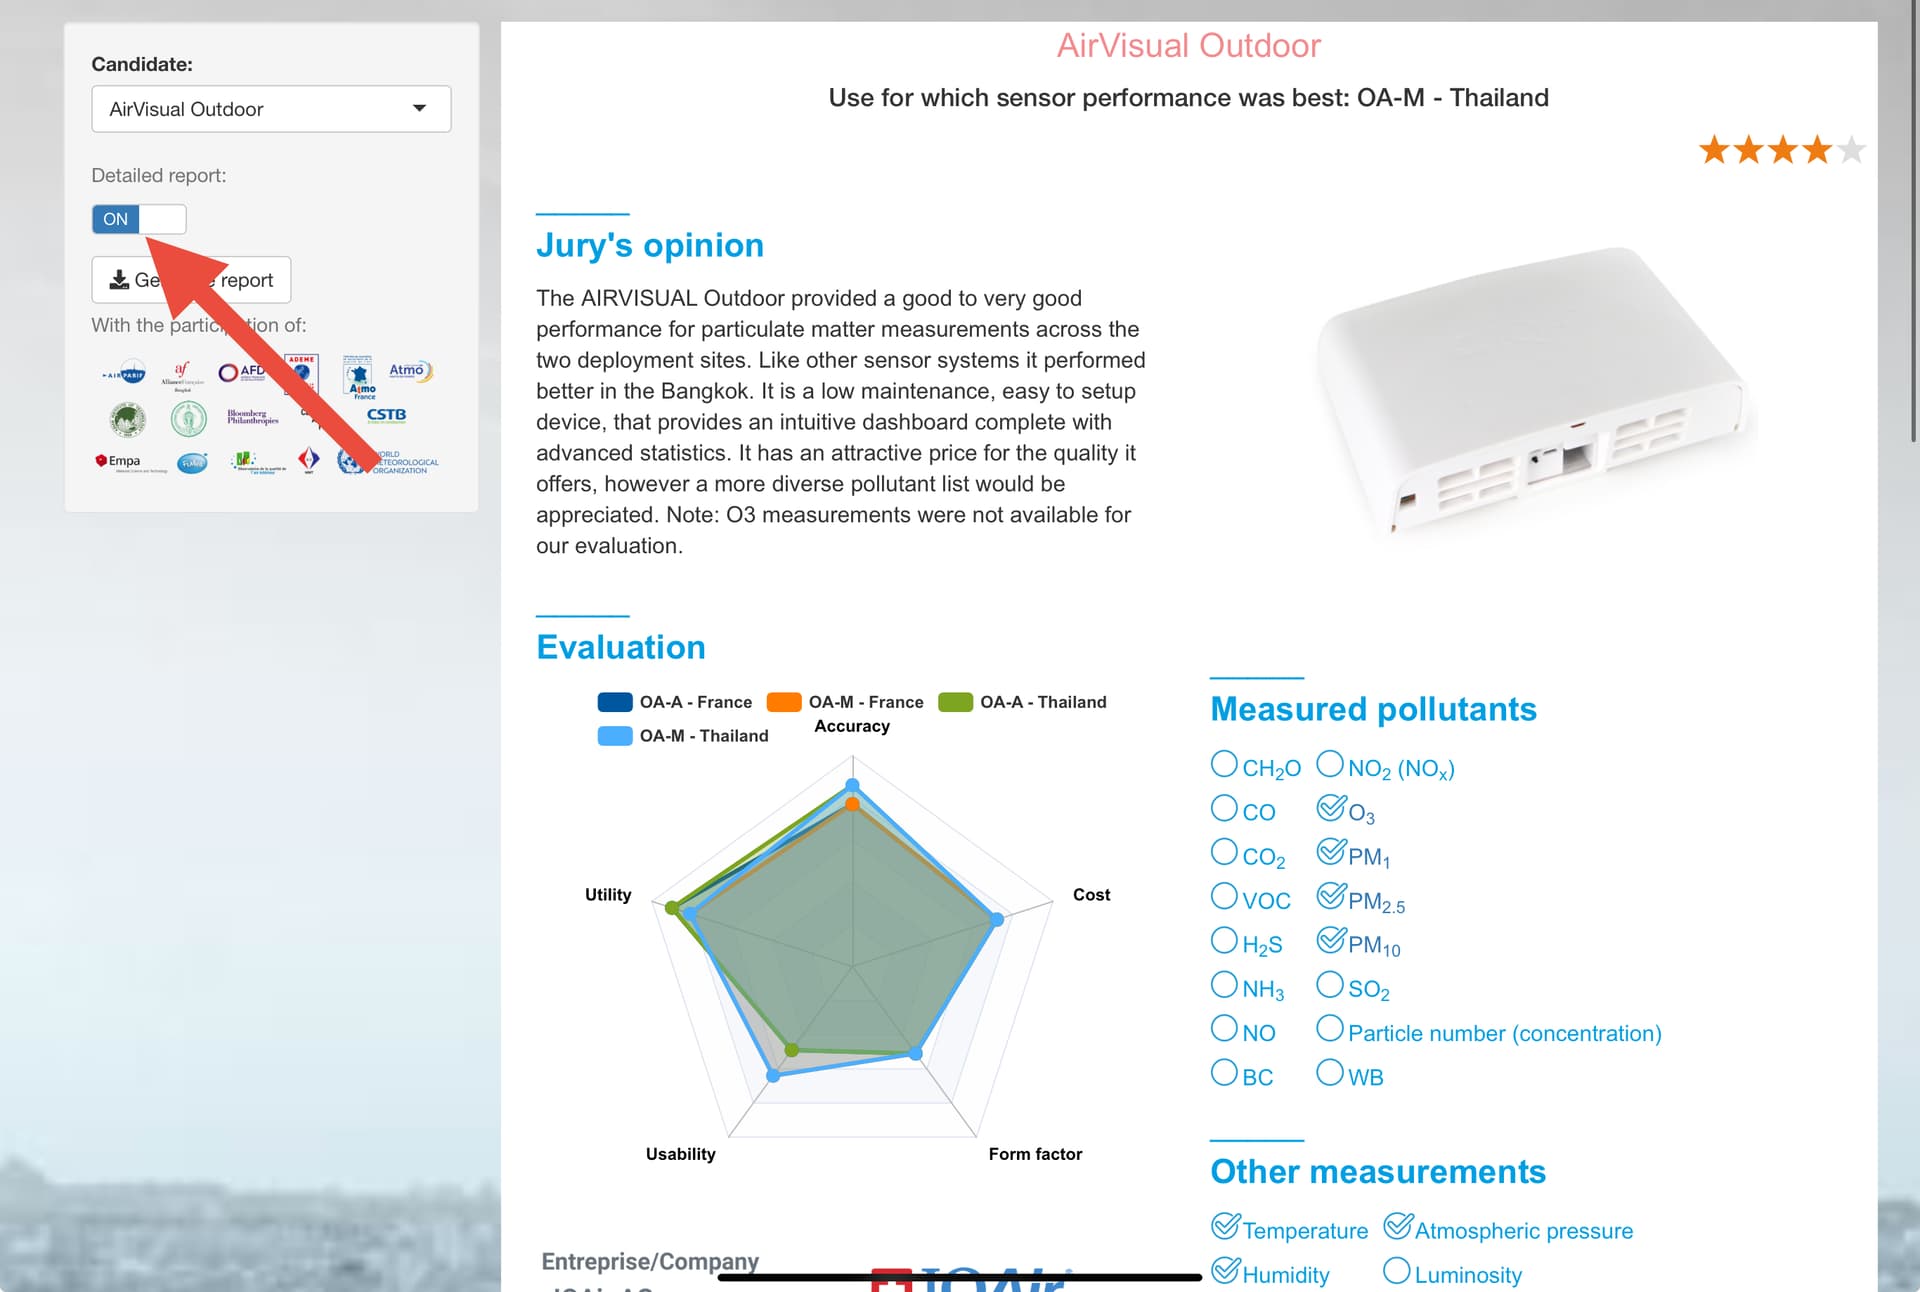
This will take you to a more detailed page similar to the one shown above. This is a lot more information, but what we really want to see are the details, such as the R-squared value. Therefore, click on the ‘Detailed Report’ toggle at the top. This will expand the page and add many more details like those shown below.
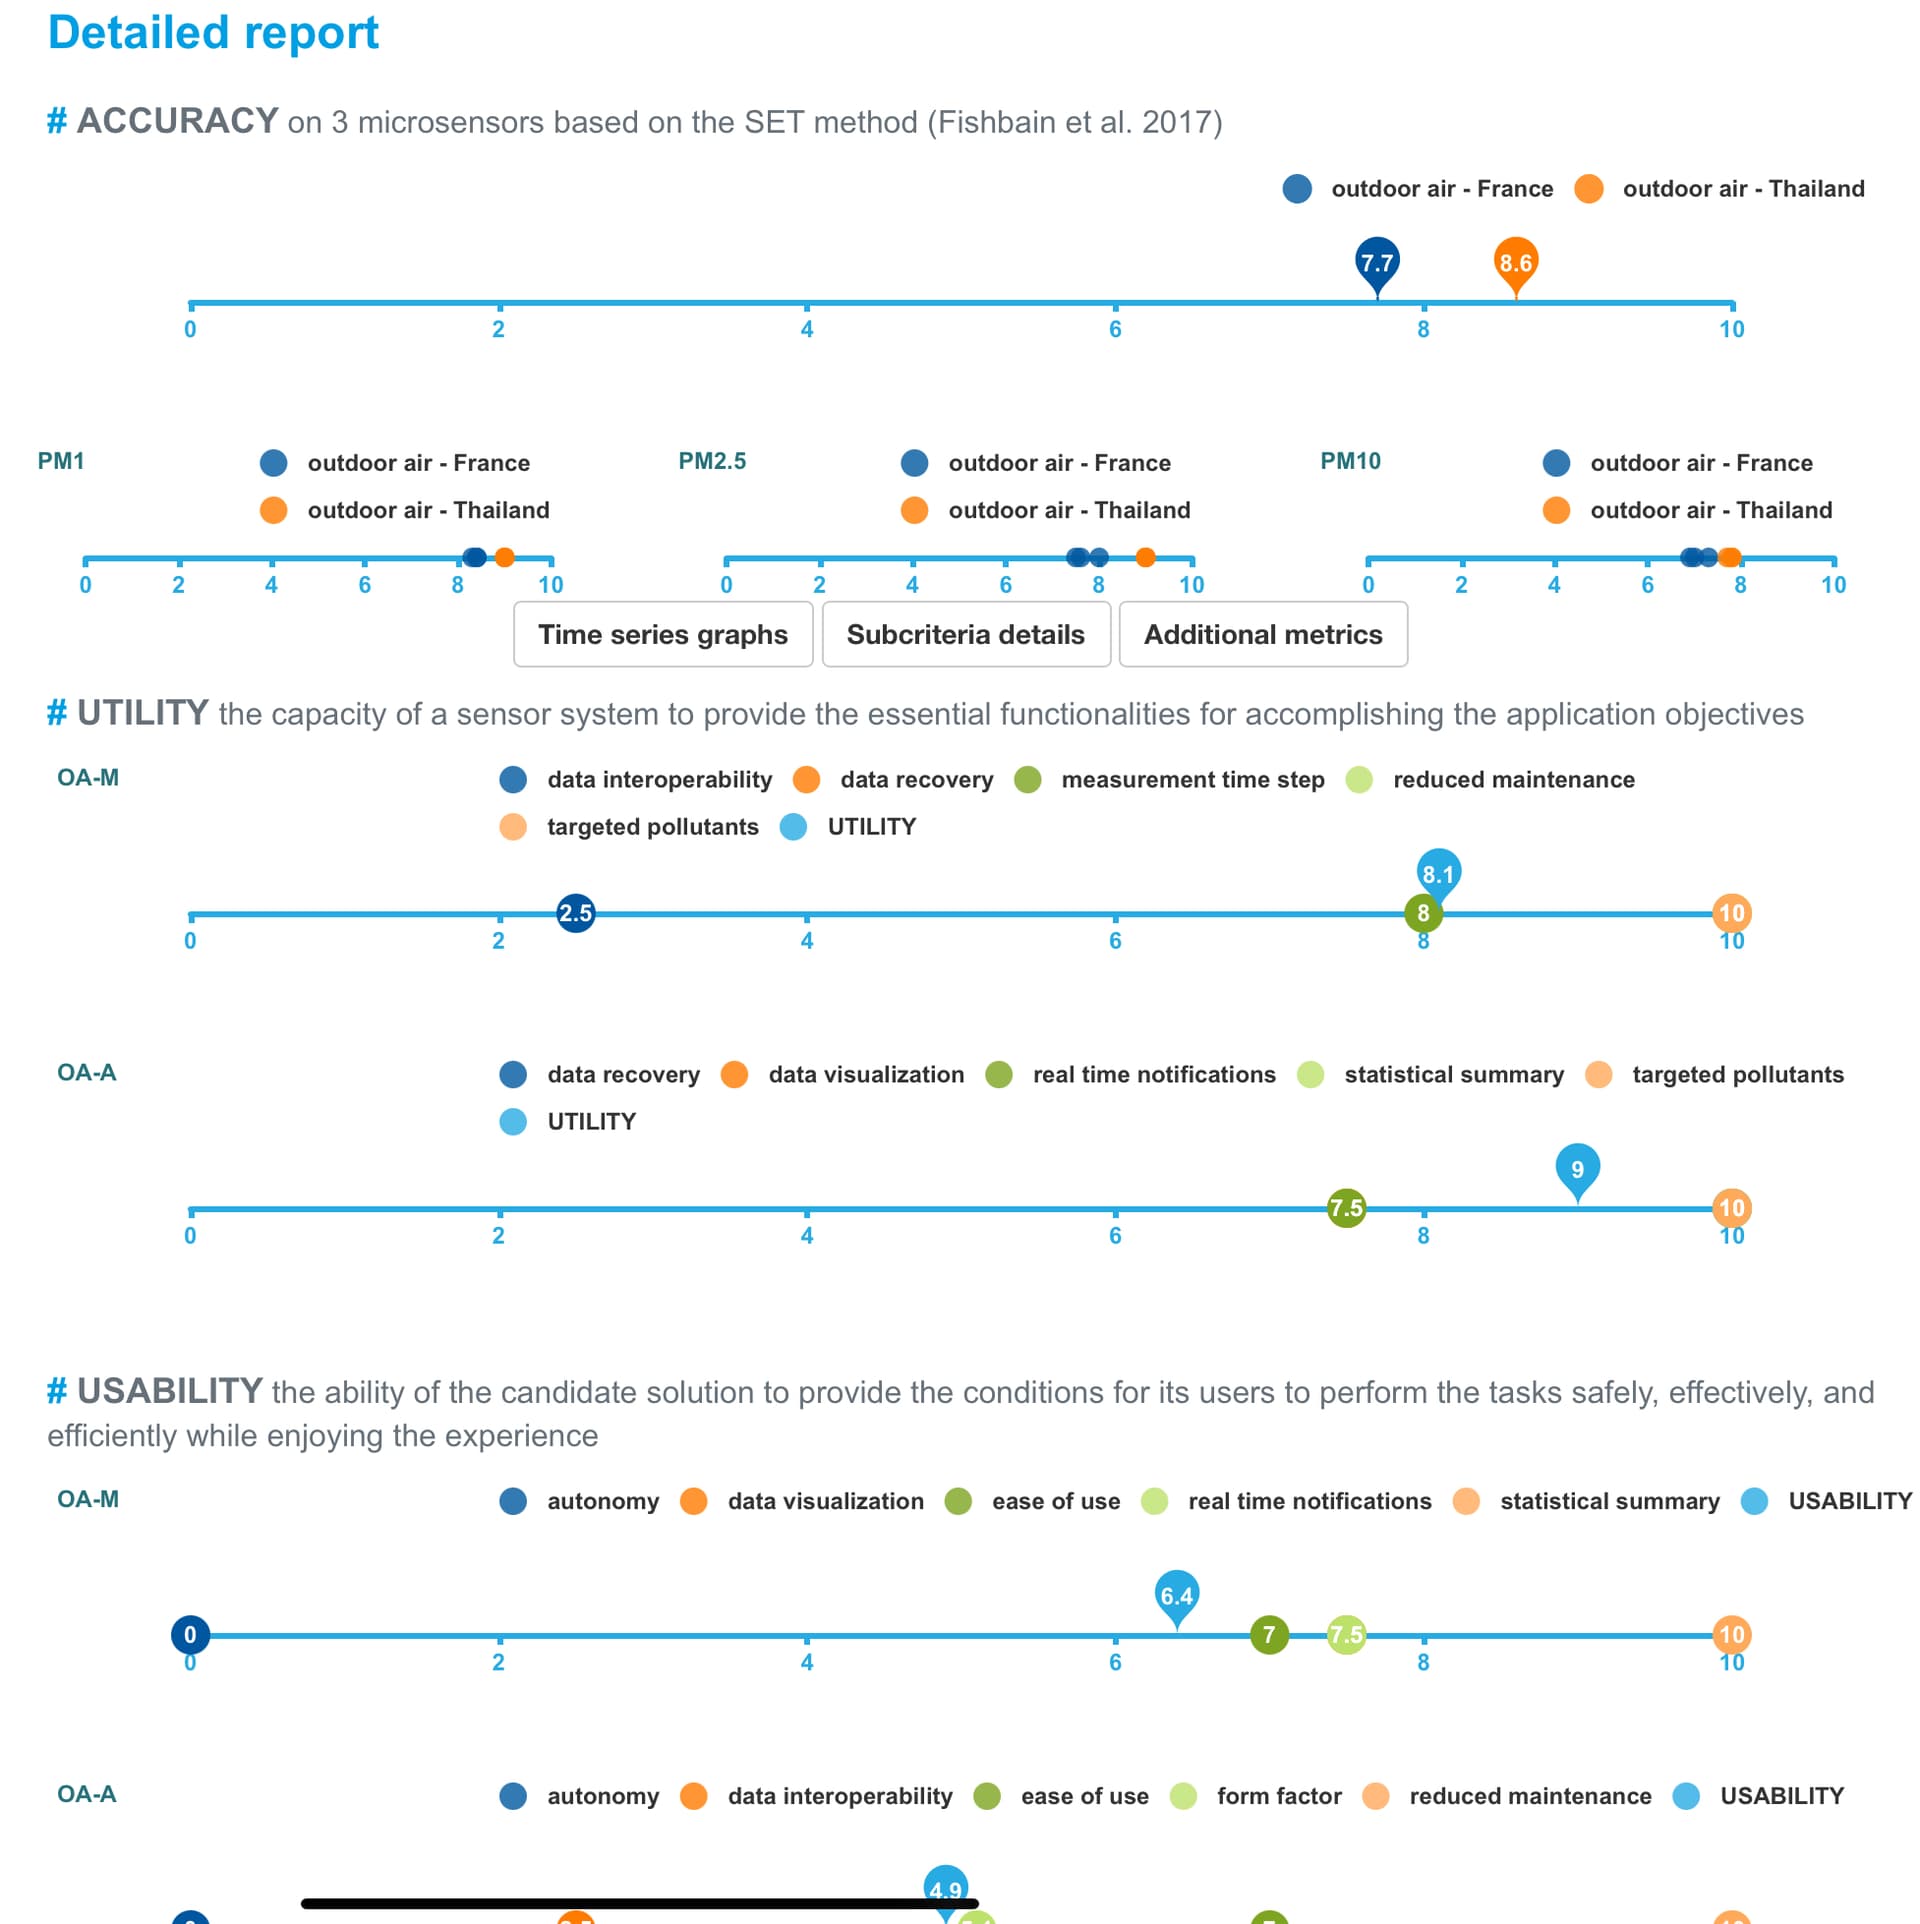
To view the statistical information, just click on ‘Subcriteria Details’ and ‘Additional Metrics’. These both include a wealth of information and show the stats for each monitor tested (three of each). While this page can be quite overwhelming, I appreciate the depth AIRLAB has taken.
Afri-SET
The third and final organisation that I am aware of which makes these comparisons and makes them publically available is Afri-SET. Now, it’s important to note that these results are from Ghana, and therefore, the conditions are likely very different to where you live, but similar to AQ-SPEC, Afri-SET results can be used to help make a purchasing decision, but you shouldn’t solely make a decision based on these results (unless, perhaps, you live in Ghana or somewhere with a very similar climate).
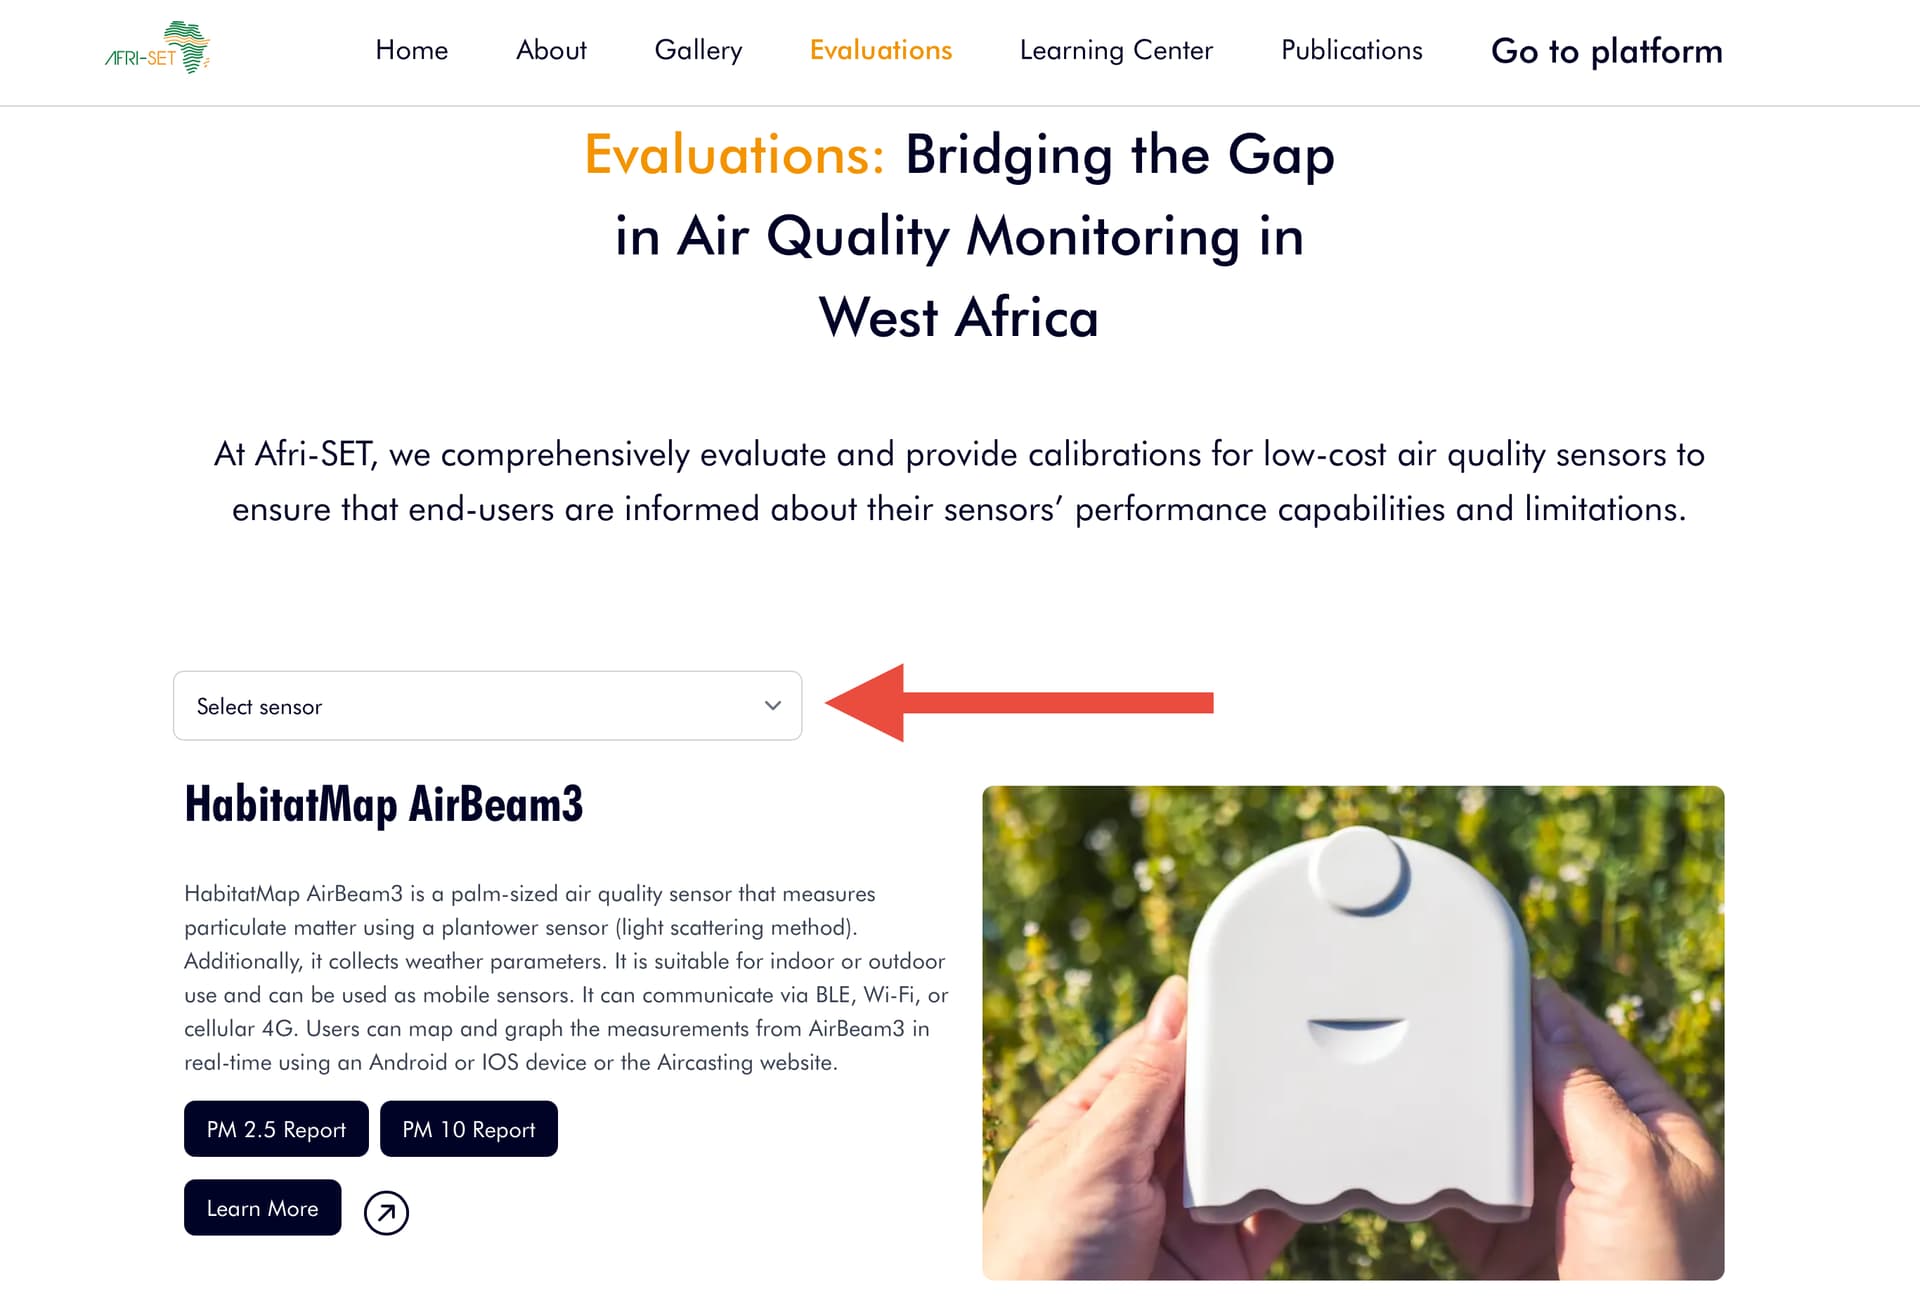
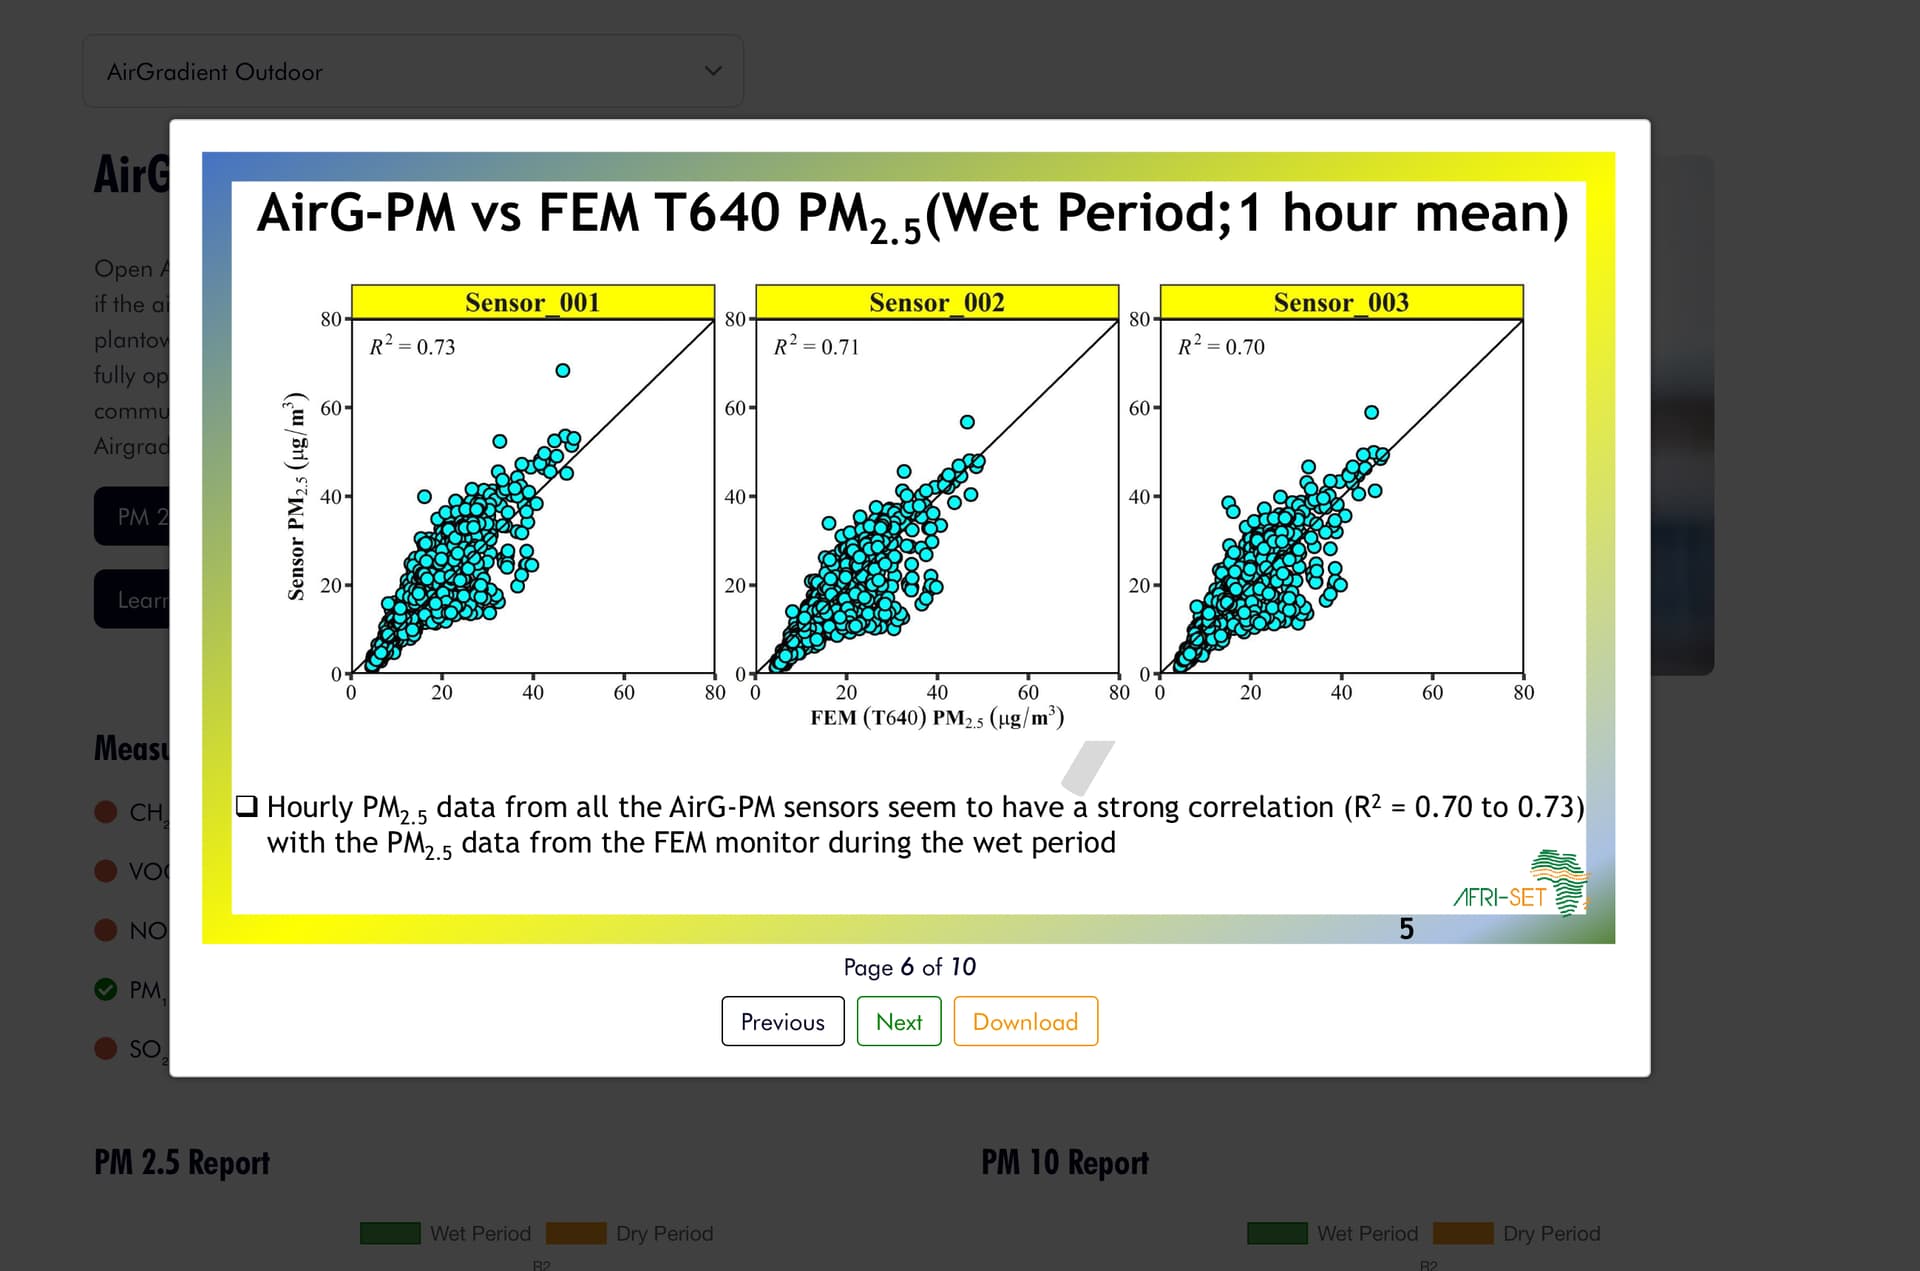
To find these results, go to the Afri-SET page and click on ‘Evaluations’. You will then be able to select the monitor that interests you. On this page, you can see the R-squared values for both the wet and dry seasons in Ghana. Each monitor is tested for 12 weeks in both seasons, and you can see the difference in performance during the two seasons, which have very different characteristics.
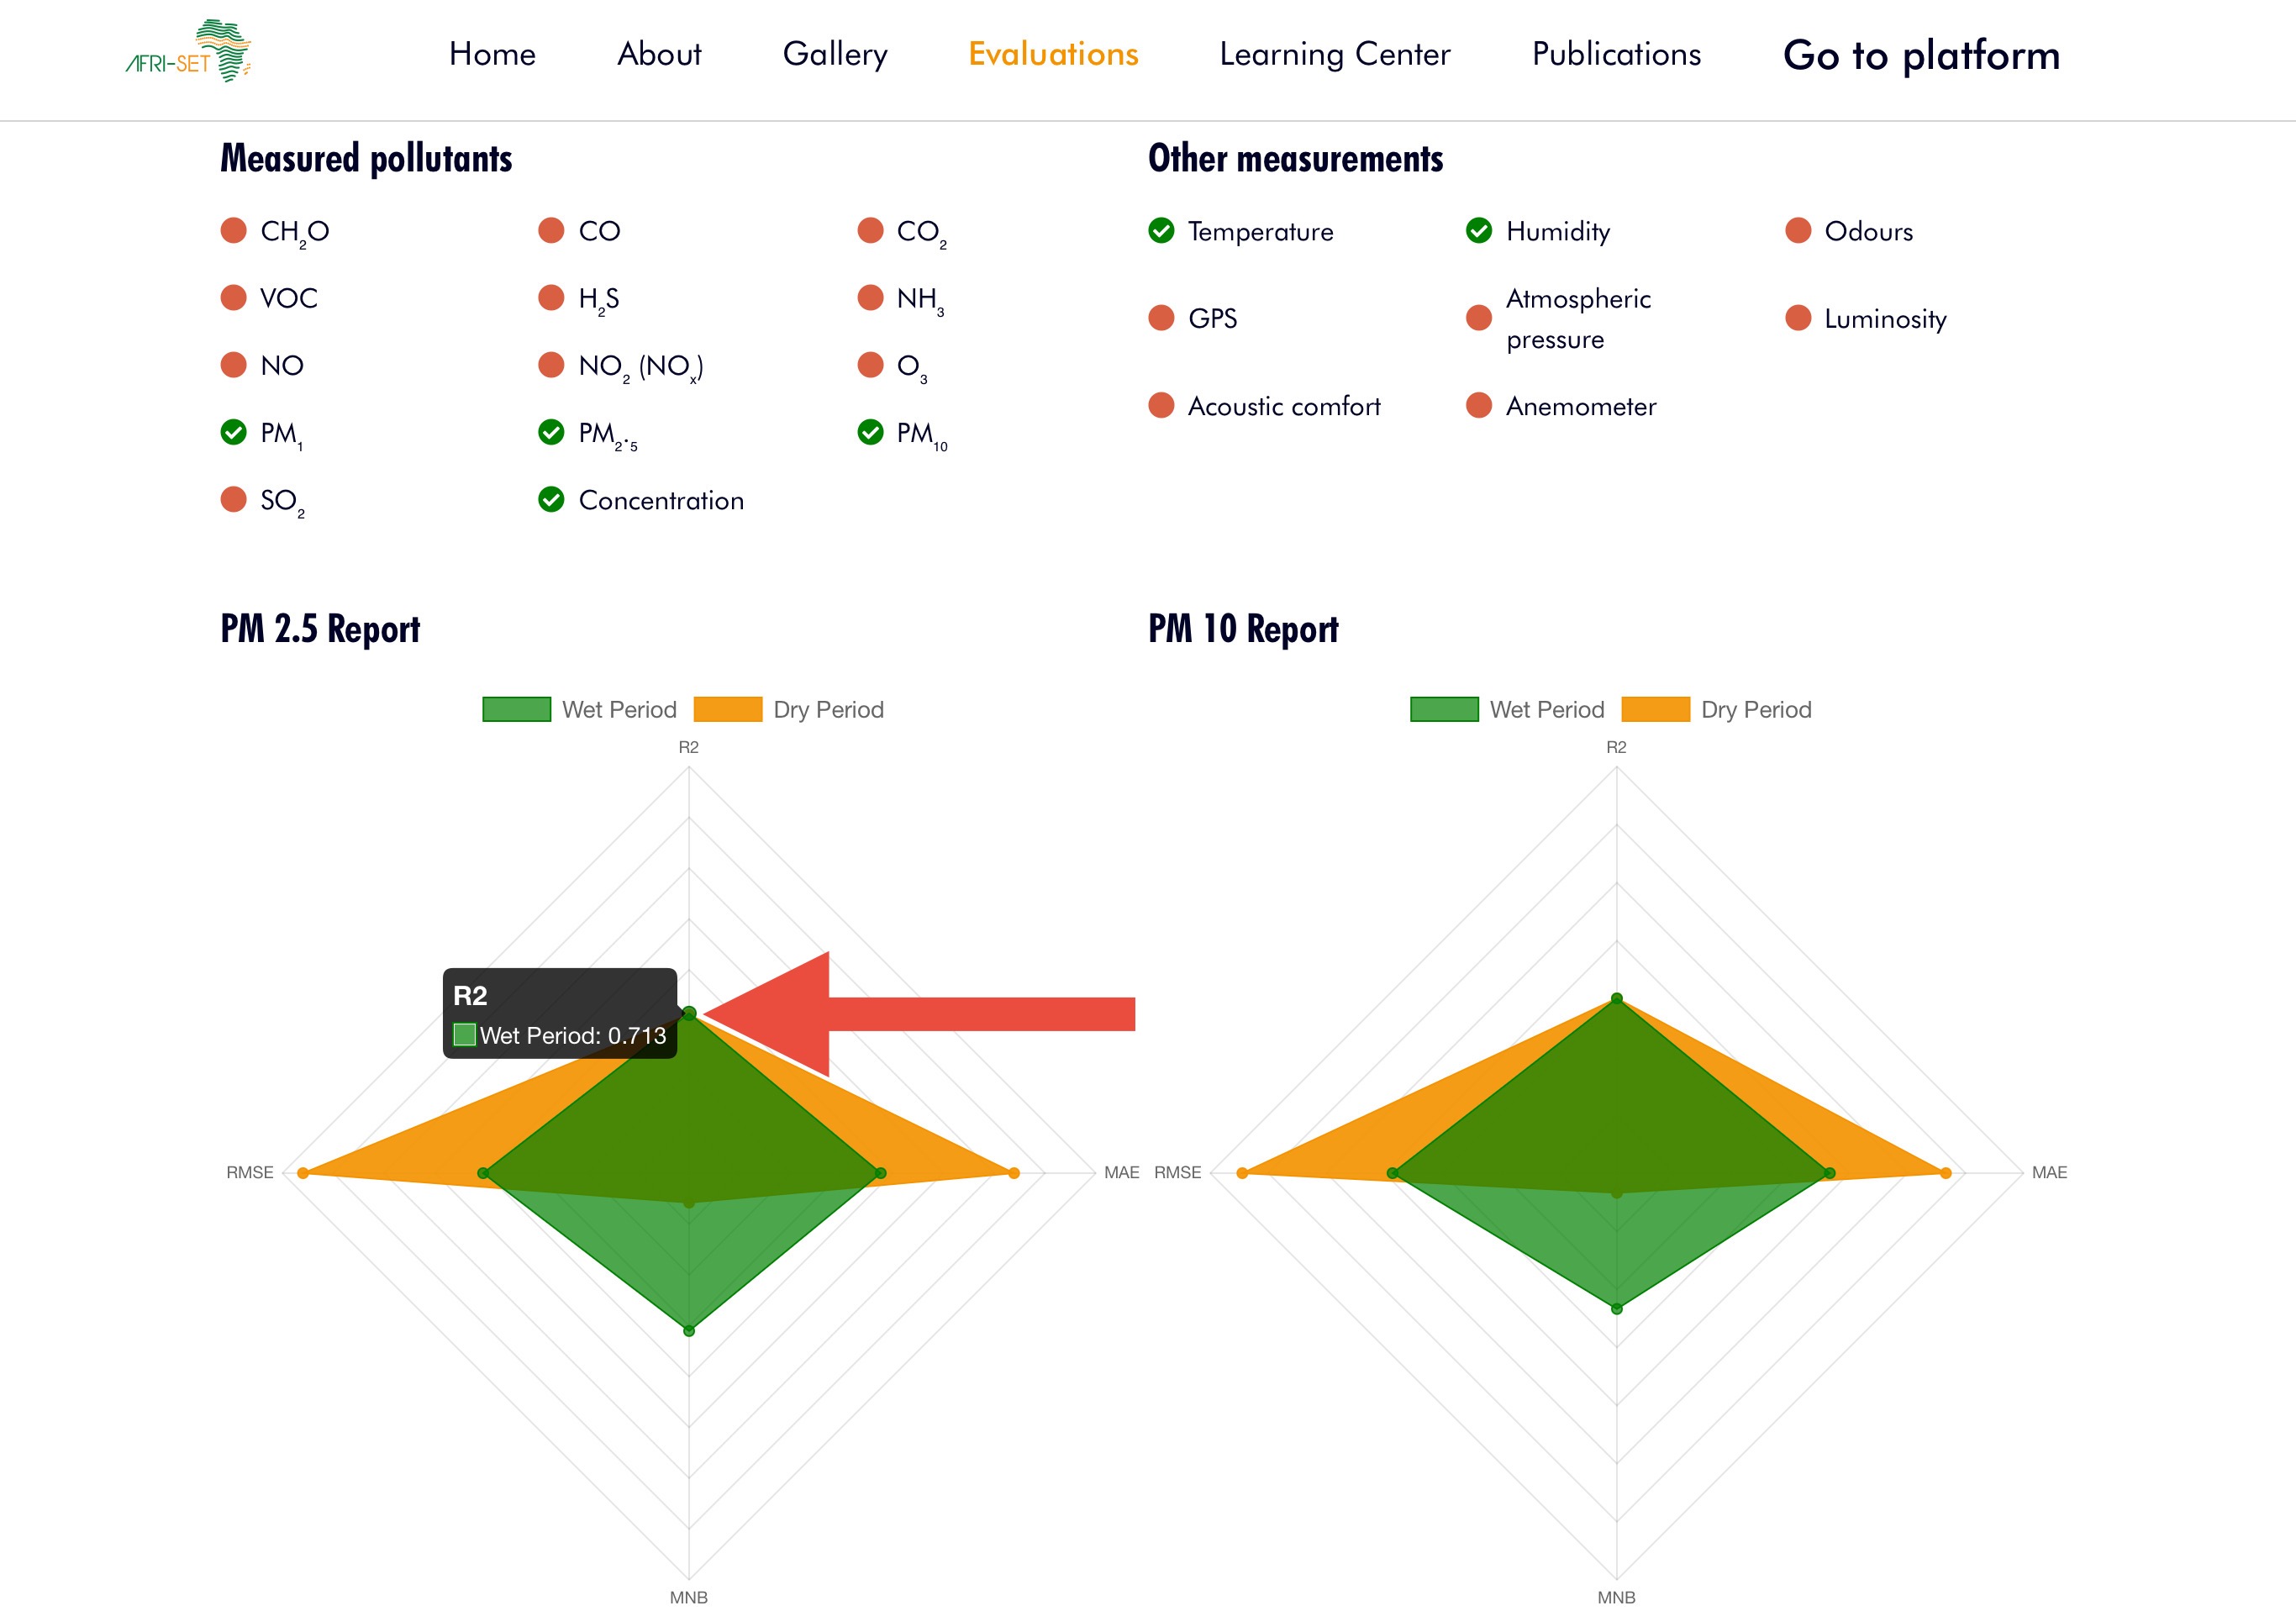
If you’re interested in further details, you can also view the whole report by clicking on ‘PM2.5 (or PM10) Report’. Since Afri-SET tests three of each monitor at the same time, the results are directly comparable but are likely not entirely relevant to you, depending on where you live.
With that said, both Afri-SET and AIRLAB also test other metrics beyond particulate matter, and these results are also worth considering if you’re looking for a well-rounded monitor.
Conclusion
If you are looking to see how accurate your air quality monitor truly is, you will need a reference-grade monitor. Unfortunately, these are very pricey and not obtainable by many. As such, databases and comparison tools like the three mentioned in this post are very valuable.
However, each one has caveats and I think that solely relying on (for example) AQ-SPEC results is not a good way to make the right monitor purchasing decision. Rather, results from each database should be considered among information from other reviews and studies. If I were to rely solely on one database, it would be something more thorough, like AIRLAB.