Hello all,
Yesterday I received my AirGradient One, and yesterday night I put it to test in our bedroom first to see how things look like. Below I share initial impressions and collected data from the night as extracted from AirGradient dashboard.
Please note that I haven’t yet had the chance to fine tune the CO2 and PM2.5 measures, so these may be affected by the lack of altitude compensation and / or relative humidity, but I think the overall trend can still be useful here.
Firstly, I was a bit concerned about the lights on the monitor (as I like to sleep on dark rooms), but by simply putting it underneath my bedside table did the trick for me to sleep well.
Before going to bed (at 9:30PM), I intentionally closed both my bedroom’s window and door, as I wanted to simulate an environment in which we slept quite often in the past (also with my daughter when she was younger, when she presented many times her nocturnal cough episodes) - back then I was unaware of CO2 issues.
So in the middle of the night I woke up having trouble sleeping and decided to open the window a little bit. At some point later on in the night, I also heard rain and strong wind. Unfortunately, I did not write down the timestamps for either case… I only know that I woke up just before 6AM and closed the window again (as my wife was still sleeping).
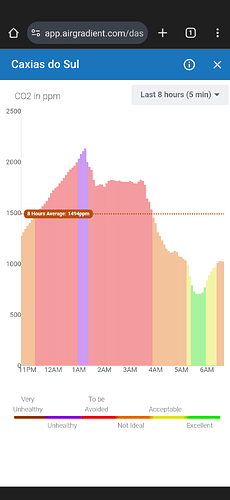
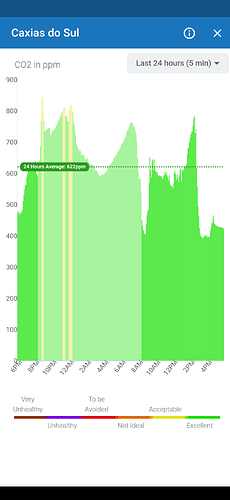
Below is the CO2 graph:
So looking at this, I would believe that I opened the window between 1AM and 2AM, when the CO2 curve stopped to increase. It still decreased slowly likely because of the window shutter - it has just tiny holes, so it doesn’t let much air come through. And I would guess that at around 3:30 the wind picked up and made the CO2 decrease quite quickly.
Anyway, maybe the timestamps and hypothesis are not right and it’s difficult to know now, but I was impressed to see how quickly the CO2 increased (and likely it was 16% higher due to altitude), and how it can potentially have affected so often our sleep quality in the past.
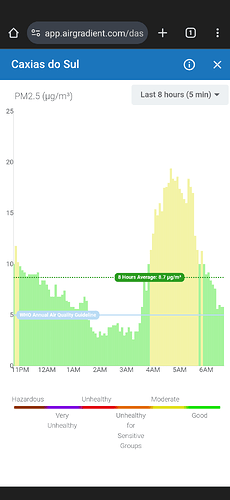
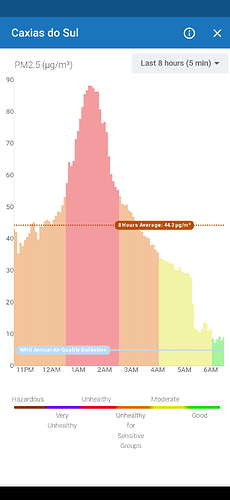
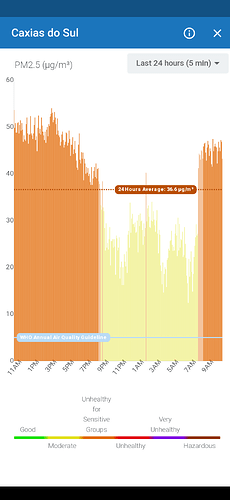
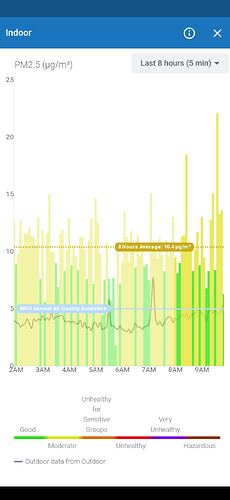
Below is now the PM2.5 graph:
I found also quite interesting to observe the opposite pattern here. In the closed and controlled environment, the PM2.5 readings decreased over time until reaching some plateau in the middle of the night. And likely when the CO2 mostly decreased (air coming in), we also observe the PM2.5 increasing. I believe the outdoor air quality was poorer than the indoor one, leading to such behavior. And this may be tricky for us to balance (although I believe in this particular case the impact of CO2 was worse than the moderate PM2.5).
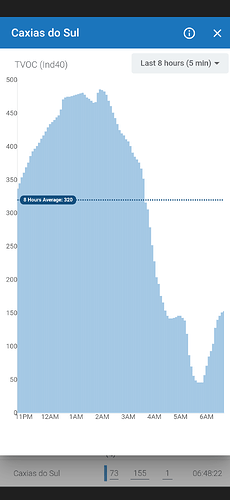
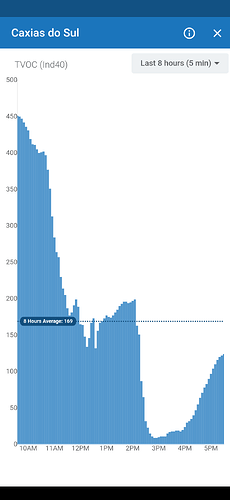
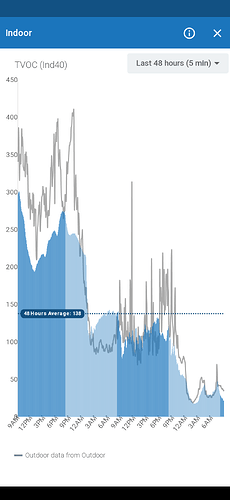
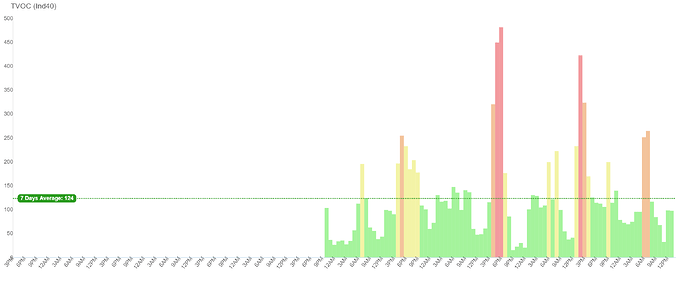
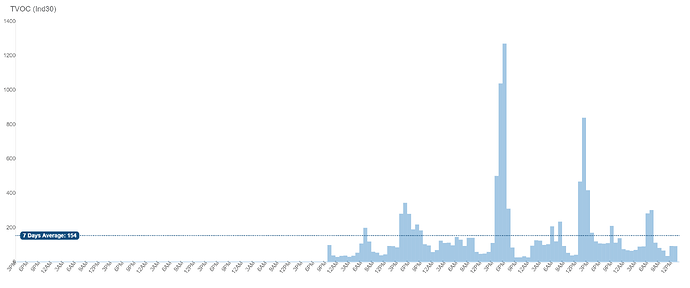
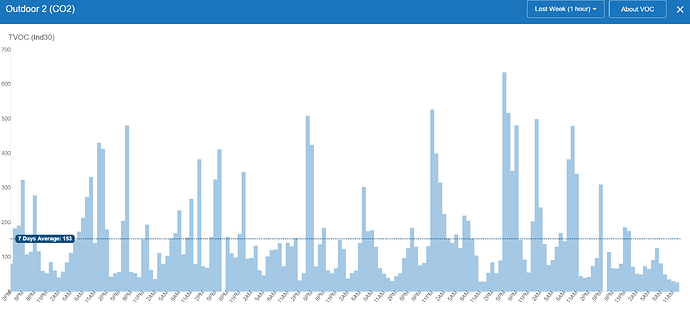
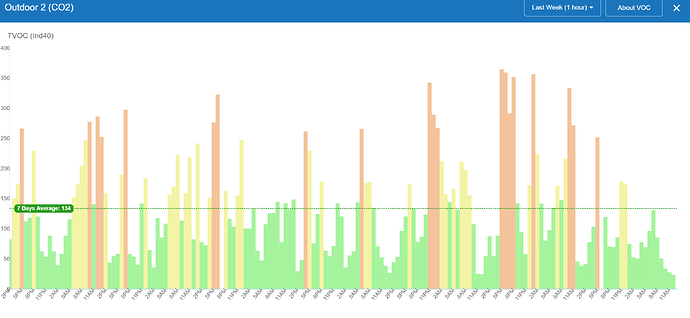
Below now is the TVOC graph:
This for me was the most intriguing behavior… I have not yet read about TVOC other than it’s a relative metric. But I was not expecting it to positively correlate with the CO2 in that way, and I would like to hear your thoughts on this
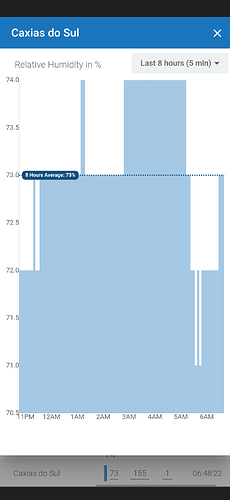
Finally, as a reference, below the RH readings throughout the night (I forgot to extract temperature, but it was always around 21.5ºC):
All in all, I’m very happy to have the AirGradient One at home and will keep exploring, learning and trying new things with it! And soon enough will also move it to my daughter’s bedroom. It’s definitely a great tool to better understand the environment we live in.
